Organic Cotton Versus Conventional Cotton
Two cotton T-shirts can look almost identical even when one uses certified organic cotton and the other uses conventional cotton. The difference begins much earlier, before the fiber reaches a spinning mill.
Organic certification regulates how the crop is grown. Land history, seed, fertilizer sources, weed control, pest management and recordkeeping all sit inside that system. After harvest, cotton moves into ginning, classing, spinning, knitting, dyeing and finishing. From that point, fiber quality and textile construction start shaping the material customers actually touch.
A 220 GSM organic cotton jersey can be rough, smooth, stable or prone to shrinkage. The same is true of conventional cotton. Those properties come from measurable fiber, yarn and fabric variables rather than from the farming label alone.
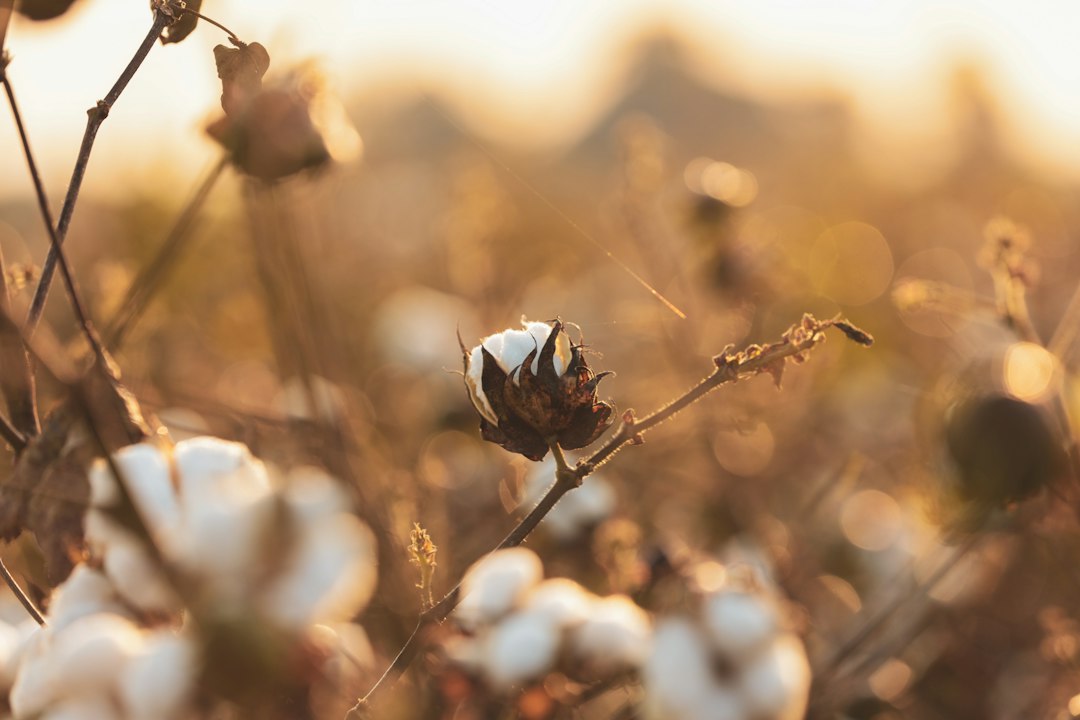
Organic Certification Starts Before the First Certified Harvest
Under USDA organic rules, prohibited substances cannot have been applied to land during the 36 months before an organic crop is harvested. A farm going through conversion can already be changing its production practices during that period, although the cotton cannot yet be sold as certified organic.
Genetically engineered seed is prohibited. Farm inputs have to meet the organic standard, and most synthetic crop-production substances are excluded unless a specific permitted use appears on the National List. Records are also required so the farm can show how the crop was produced and how unintended contact with prohibited materials is being managed.
At this point there is still no fabric GSM, no yarn count and no shrinkage figure. Those only appear after the cotton enters textile production.
What Organic Pest Management Looks Like in a Real Field
A four-year farming-system experiment in Madhya Pradesh, India recorded the materials used in its organic cotton plots. The crop-protection program included Beavicide, based on Beauveria bassiana; NeemAzal, made from neem kernels; Verelac, containing Verticillium lecanii; a fermented mixture of garlic, onion and chili; and another preparation made from leaves of ten wild plants.
The trial maintained separate conventional plots using the regional synthetic crop-protection program.
These records are useful because they show why “pesticide-free cotton” is an inaccurate description of organic production. Organic cotton still has to survive sucking insects, bollworms, weeds and plant diseases. The certification standard limits the methods and substances that can be used.
Counting spray applications alone also tells very little. A meaningful comparison needs the active ingredient, application rate, treated area, frequency and relevant toxicity data.
Nitrogen Comes From a Different Fertility Program
The same Madhya Pradesh experiment was established on a semi-arid Vertisol containing about 600 g/kg clay, with an initial pH of 8.7 and around 5.0 g/kg organic carbon. Average annual rainfall in the region was close to 800 mm.
Organic cotton in the area was fertilized with materials such as compost, farmyard manure and castor cake. Farmers commonly applied about 18.5 tonnes of fresh compost per hectare of cotton. In the trial, half of the compost was incorporated before planting, with the remainder applied around square formation and flowering.
The mineral-fertilizer program used inputs including DAP, urea, muriate of potash and single super phosphate. Averaged across the crops and years in the farming-system experiment, fertilizer-derived nitrogen was 65 kg N/ha in the organic systems, 105 kg N/ha in the conventional non-Bt system and 113 kg N/ha in the system containing Bt cotton. Nitrogen supplied through green-manure crops was not included in those figures.
During the first cotton cycle, the reported nitrogen inputs reached 146 kg N/ha in conventional non-Bt cotton and 166 kg N/ha in Bt cotton.
The numbers make sense only inside the conditions of that trial: its soil, crop rotation, climate and local farming practices.
Soil Carbon Took Years to Separate
Later work on the same farming systems followed the soil for 12 years. Organic management eventually produced soil organic carbon stocks about 13% higher than the conventional systems, with statistically significant differences becoming visible after roughly eight years.
The change was not uniform through the soil profile. Nitrogen differences were more pronounced in the upper layer, and crop sequence also influenced phosphorus, potassium and carbon.
That time scale matters. A soil sample collected after one or two cotton seasons would not have captured the pattern that appeared later. Starting soil condition, sampling depth, tillage, crop rotation, erosion, rainfall and temperature all affect what a soil-carbon result means.
Water Use Changes Dramatically From One Cotton Region to Another
The claim that organic cotton uses 91% less water has been repeated widely in fashion content. The number came from comparisons between older life-cycle datasets and was never a universal farm-conversion figure.
The 2026 Textile Exchange cotton LCA makes the regional spread easier to see.
For India, its baseline inventory reports 3,177.4 kg of blue-water consumption per kg of fiber for the country-average dataset and 3,356.6 kg/kg for the organic dataset. A different indicator in the same report, which weights water use according to local scarcity, gives 111.0 m³ equivalent/kg fiber for the Indian country-average dataset and 98.7 m³ equivalent/kg for the organic dataset.
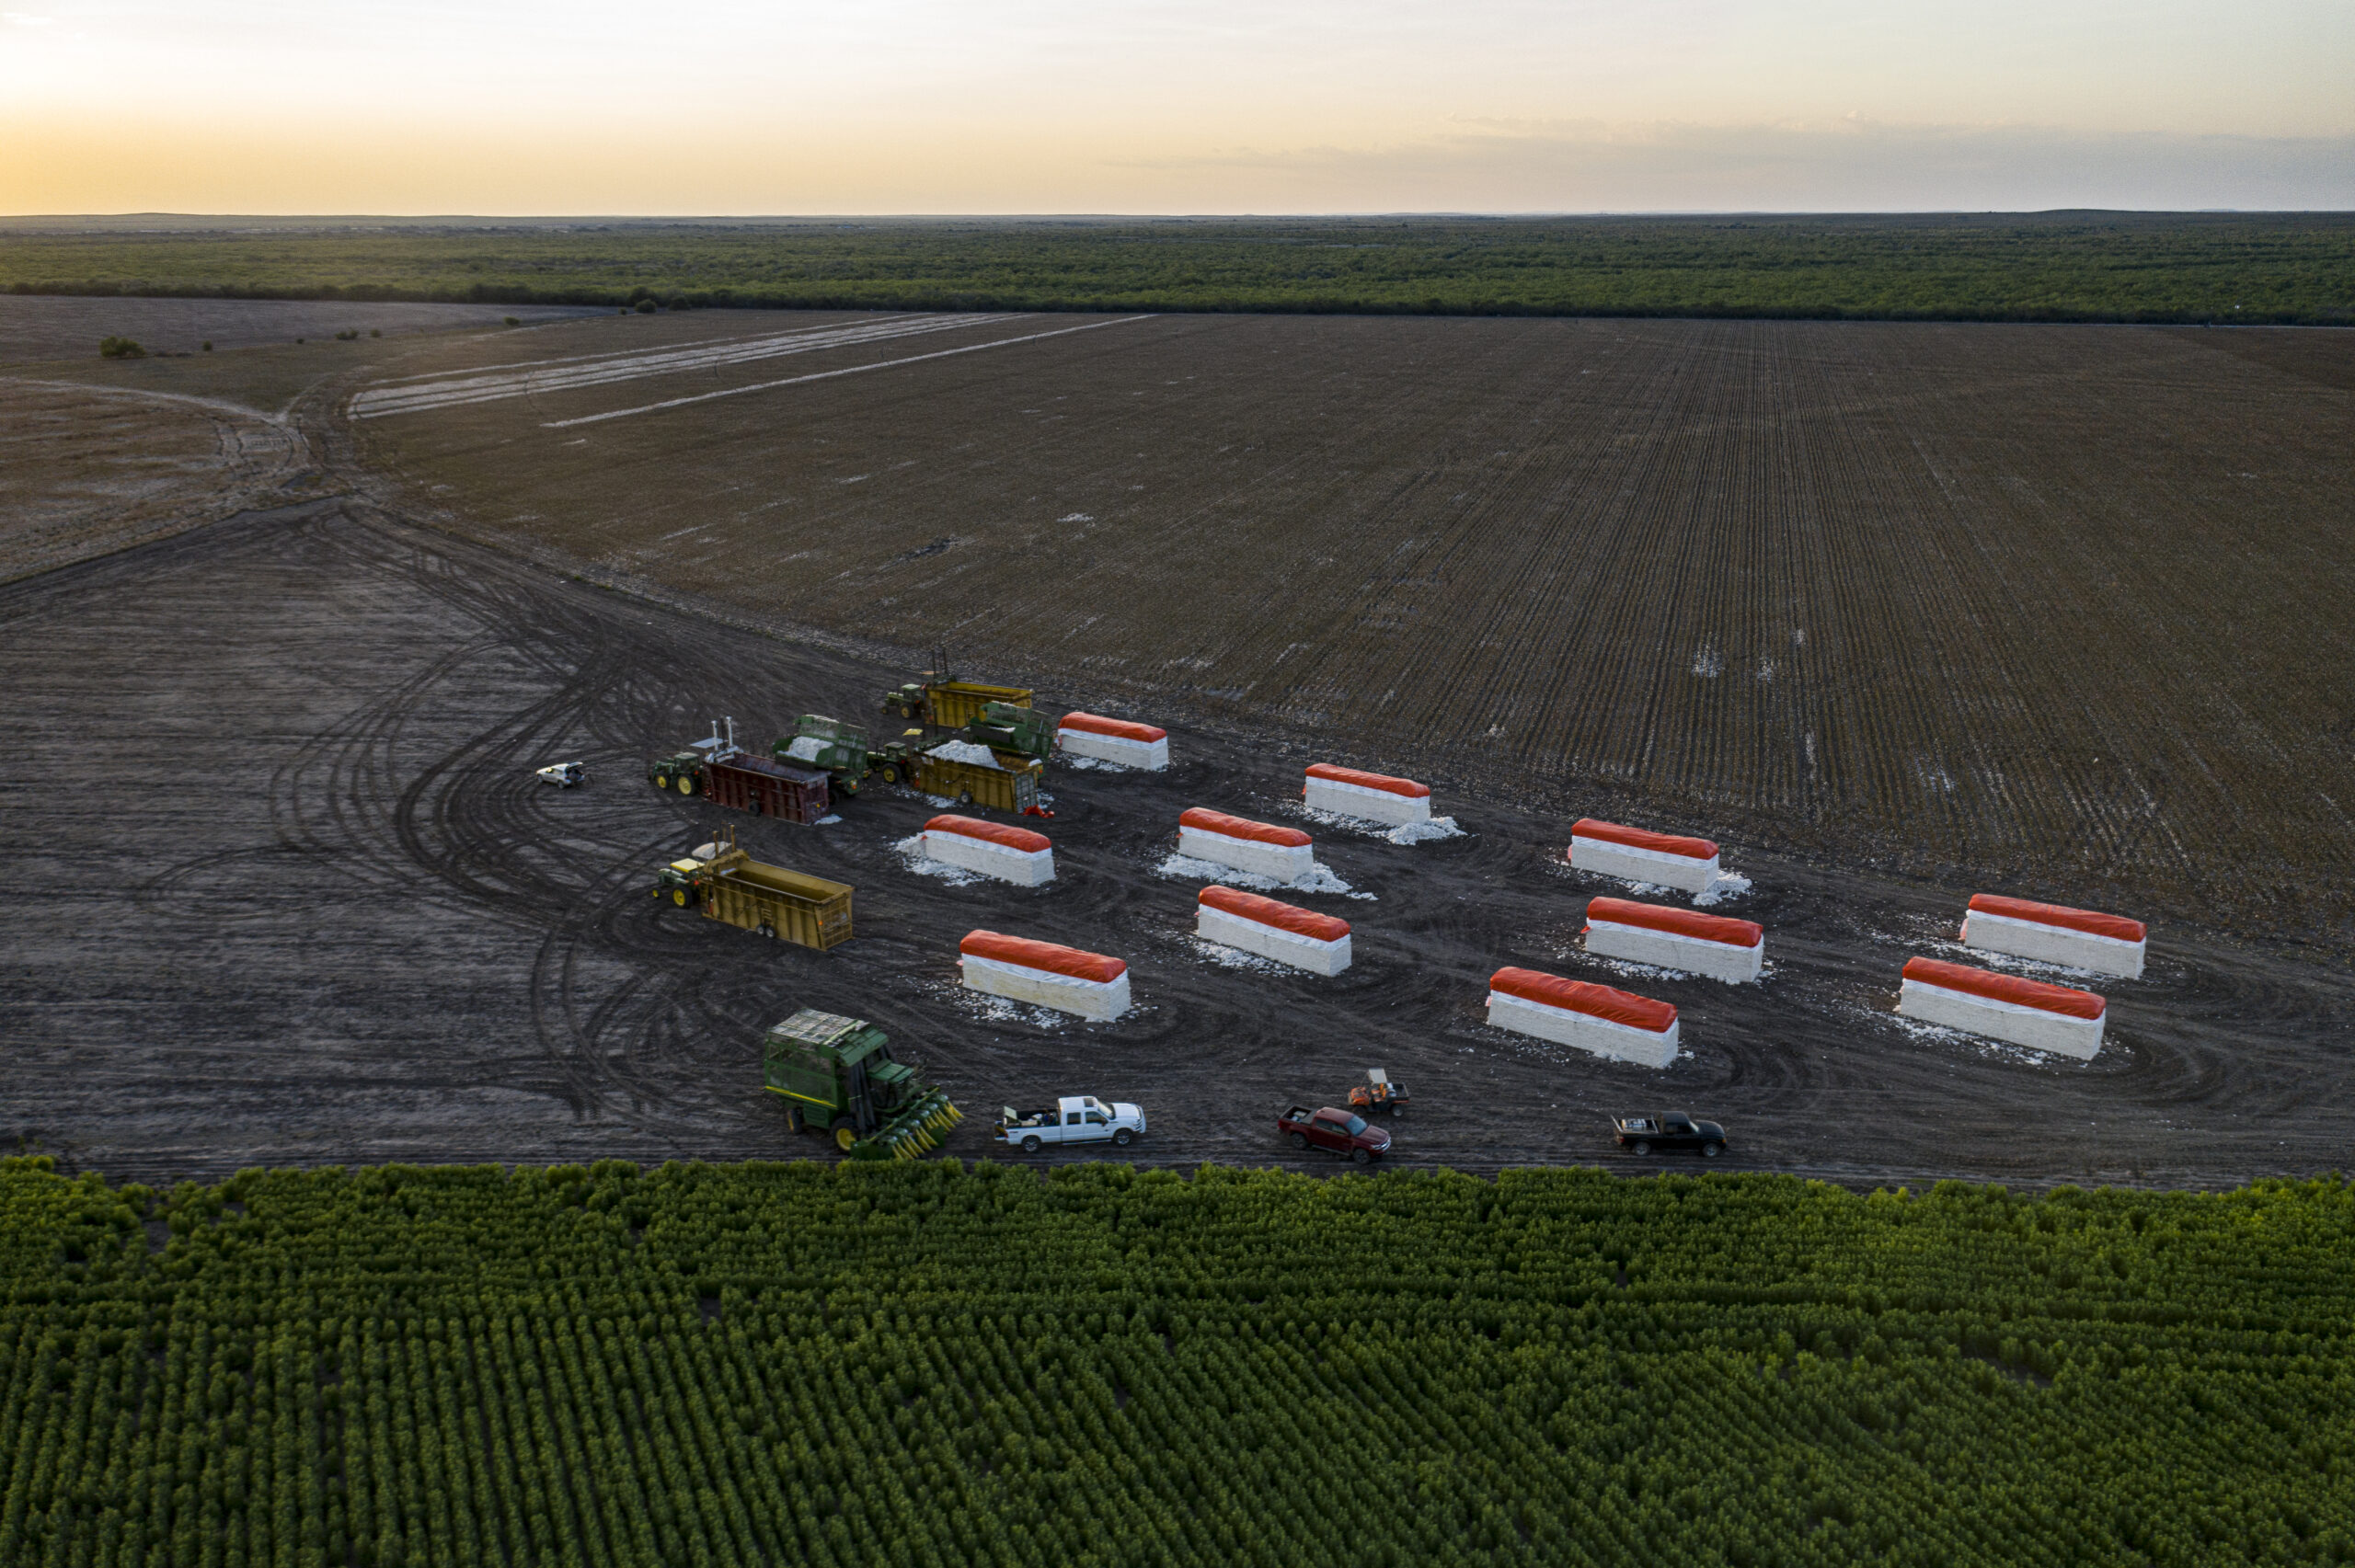
Brazil looks completely different. The baseline blue-water figures are about 47.9 kg/kg fiber for the country-average dataset and 3.4 kg/kg for the organic dataset. Türkiye records 1,679.0 and 2,418.2 kg/kg. The U.S. figures are 1,118.2 and 1,528.6 kg/kg.
These are not controlled field pairs. Each dataset carries its own geography, irrigation pattern, yield and modelling assumptions. A rain-fed field in one region and an irrigated field in another can produce very different water results regardless of the certification label.
Yield Changes the Result per Kilogram
Many life-cycle results are calculated per kilogram of fiber, so crop output matters directly.
A simple example shows the arithmetic. If a production system carries 700 impact units and produces 1,000 kg of cotton, the result is 0.70 units/kg. If another system carries 600 impact units and produces only 700 kg, the result becomes about 0.86 units/kg.
The Madhya Pradesh trial gives a real example of how yield moved over time. Across 2007–2010, organic seed-cotton yields averaged about 14% below the conventional systems, although the gap was not constant from one crop cycle to the next.
Cotton was planted at around 9,070 plants/ha, and irrigation access was broadly comparable between the systems. After the monsoon, cotton received drip irrigation followed by two to three flood irrigations.
Longer-term analysis from the same experiment later placed organic cotton at roughly 93% of the yield of conventional non-Bt cotton and 82% of conventional Bt cotton over the extended study period.
Research from California has produced different numbers. A six-year dataset cited in the same body of literature reported organic yields 19% below conventional management and 34% below an integrated pest-management system. Cotton varieties were not identical in every year, which limits how far those percentages can be carried outside the trial.
The 2026 Cotton LCA Shows How Much Regional Context Matters
Textile Exchange's 2026 assessment covers cotton cultivation through lint leaving the gin and includes datasets from Bangladesh, Brazil, China, India, Pakistan, Peru, Tanzania, Türkiye and the United States.
Climate-change results vary widely. India is listed at 4.17 kg CO₂e/kg fiber for the country-average dataset and 1.46 kg CO₂e/kg for the organic dataset. Brazil appears at 2.46 and 0.44 kg CO₂e/kg. Türkiye records 1.29 and 0.95 kg CO₂e/kg. The U.S. datasets are 1.55 and 1.77 kg CO₂e/kg.
Those figures come from different regional datasets rather than from one controlled experiment. The report itself is non-comparative and warns against turning the numbers into a simple ranking of farming systems.
Nitrogen-related field emissions are one of the major hotspots in the assessment. Irrigation energy becomes important in some regions, and yield changes the result whenever impact is expressed per kilogram of fiber. Even within one country, the production mix can differ: the U.S. organic dataset has a strong Texas context, whereas the country-average dataset represents a broader range of cotton production.
Fiber Quality Starts to Matter More After Ginning
Once lint has been separated from seed, the spinner needs to know what the fiber can actually do.
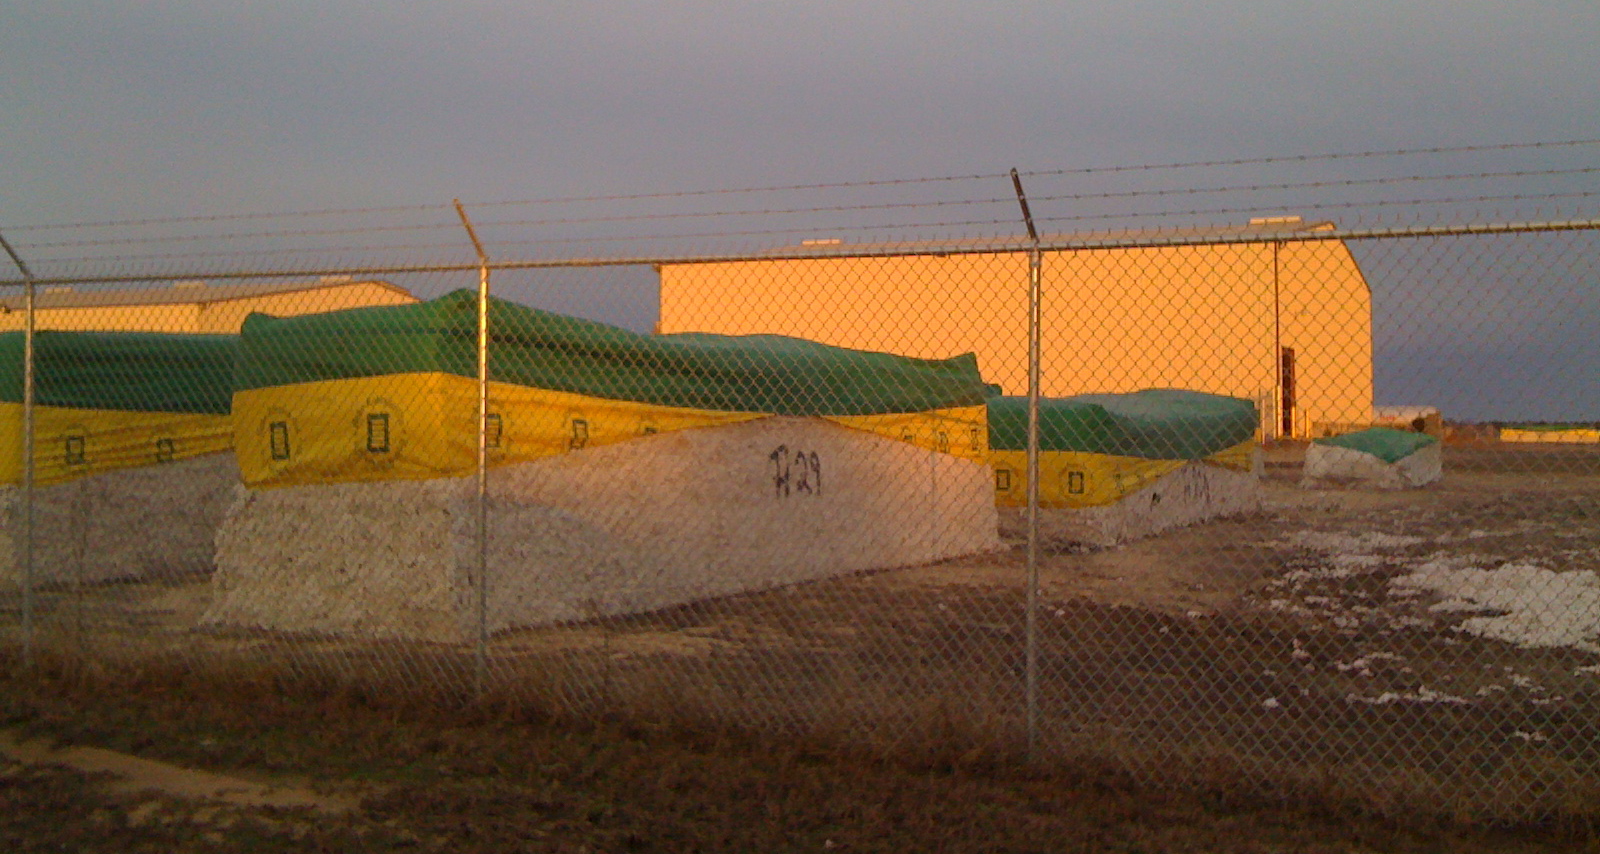
The completed 2025–2026 U.S. Upland crop included about 12.98 million classed bales. Average results were 4.36 micronaire, 1.143 inches upper-half mean length, 81.66% length uniformity and 30.99 g/tex strength.
Regional variation shows why mills do not buy cotton on a certification label alone. In the 2024–2025 crop, cotton classed through Visalia averaged about 1.17 inches in length, 81.4% uniformity and 32.0 g/tex strength, with average micronaire at 4.31. Lamesa averaged about 1.10 inches, 79.8% uniformity and 29.9 g/tex strength, with micronaire at 4.21.
A spinner planning a fine combed yarn wants enough fiber length for good overlap inside the yarn, a manageable short-fiber fraction, suitable maturity and enough strength for the target count. Micronaire helps indicate fineness and maturity, and poor length uniformity can create more difficulty during drafting.
An organic bale still has to meet those physical requirements.
Spinning Can Change the Fabric Before the Knitting Machine Does
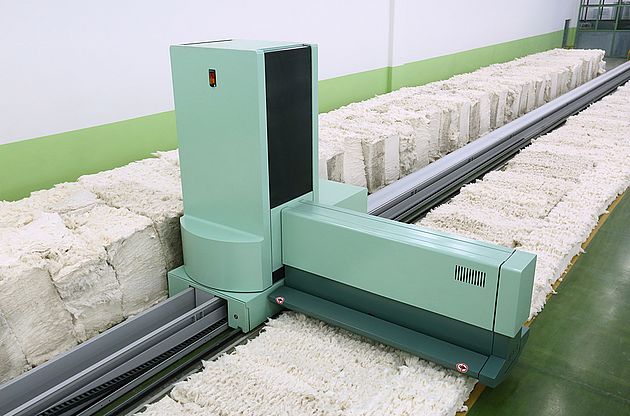
A controlled study produced 30/1 Ne ring-spun and compact-spun yarn from the same cotton blend. Fiber preparation before spinning was kept the same, and both yarns were later knitted into single jersey on a 20-inch, 24-gauge machine.
The compact yarn reached 18.67 cN/tex tenacity. The ring-spun yarn measured 16.66 cN/tex. Uster hairiness was 4.22 for the compact yarn and 5.76 for the ring yarn, with CVm values of 11.31% and 11.53%.
Those changes came from the spinning route. Combing can alter the yarn again by removing a portion of short fibers and neps. Twist influences cohesion, torque and surface character. Once the fabric has been knitted, enzyme treatment can remove projecting cellulose from the surface.
A T-shirt can therefore feel cleaner and smoother because of yarn and finishing choices made long after the cotton leaves the farm.
A 150 GSM T-Shirt Study Shows What Finished-Fabric Testing Can Find
A 2018 study compared organic-cotton and conventional-cotton T-shirts made to closely matched specifications. Both fabrics used 30s combed yarn, 150 GSM single jersey and the same basic knitting construction.
The machine setup was tightly controlled: 30-inch cylinder, 24 gauge, 90 feeders, 2,256 needles, 30 rpm and 2.8 mm loop length. Production conditions were about 30 ± 2°C and 65 ± 2% relative humidity.

For abrasion testing, Martindale pressure was set at 9 kPa. Neither fabric developed a hole through 7,000 rubs. Weight loss measured 4.47 ± 0.12% for the conventional sample and 6.55 ± 0.05% for the organic sample.
Bursting strength under ASTM D3786 measured 5.26 ± 0.13 kg/cm² for the conventional fabric and 4.29 ± 0.12 kg/cm² for the organic fabric.
Pilling developed at almost the same rate. Both samples received Grade 3 after 125 cycles, stayed at Grade 3 after 500 cycles, reached Grade 2 at 1,000 cycles and finished at Grade 1 after 2,000 cycles.
For dimensional stability, the garments were conditioned, marked at 25 cm reference lengths, washed at 40°C with standard detergent and tumble dried. The conventional sample showed 2.56 ± 0.23% length shrinkage and 2.8 ± 0.03% width shrinkage. The organic sample recorded 1.52 ± 0.15% length shrinkage and 1.36 ± 0.09% width growth. Spirality was 0% in the conventional sample and 2.5% in the organic sample.
The raw cotton supplies were different, so the study cannot isolate farming method as the cause of these fabric results. It is still useful because it shows how much performance has to be measured on the finished textile rather than assumed from the fiber claim.
Black Cotton Still Has to Go Through a Dye House
A black organic cotton T-shirt begins as naturally colored raw fiber. The black shade appears later.
Before dyeing, cotton usually needs preparation so the material wets evenly. Natural waxes and other non-cellulosic substances are removed or reduced during scouring. Dyeing then introduces color and process auxiliaries, followed by wash-off to remove unfixed material. Compaction or other finishing operations can follow.
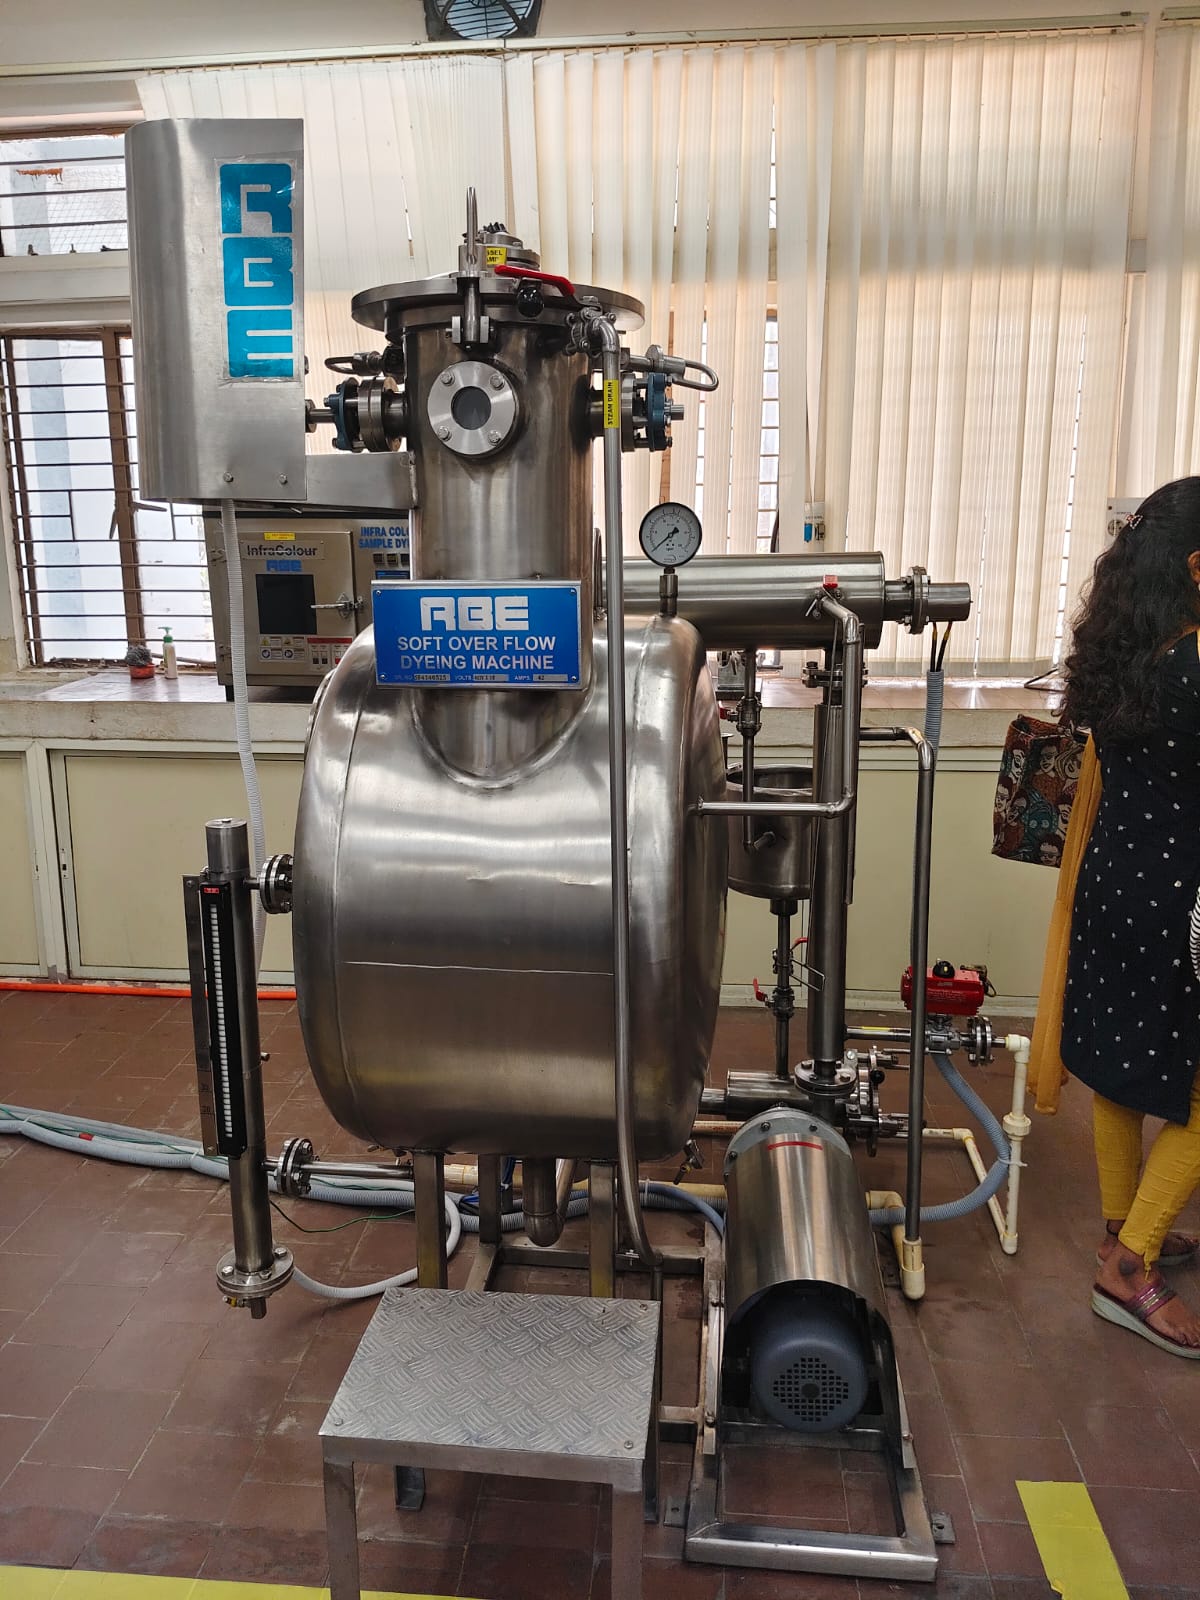
Deep reactive shades can use substantial electrolyte. Industrial literature reports roughly 0.6–0.8 kg of salt per kg of fiber in some conventional reactive-dye routes, depending on the dye chemistry, shade depth and process design.
One industrial jet-black study used a shade depth of 9.95%. Dye fixation measured 51.7% in the conventional process. A cationized salt-free route in the same work reached 58.2%.
A 2026 laboratory study used 40 g/L GTA, 1 g/L NaOH and treatment at 90°C for 50 minutes before salt-free dyeing. Reactive Black 5 was then applied at 60°C with a 1:15 liquor ratio and held for 20 minutes under the reported optimum conditions.
These are examples of actual cotton-processing routes. A mill may use a different recipe, machinery setup or dye system.
GOTS Extends the Certification Path Into Textile Processing
GOTS Version 8.0 sets the Organic label grade at a minimum of 95% certified organic fiber under the standard's calculation rules. The Made with organic materials grade begins at 70% certified organic fiber.
Version 8.0 was released in March 2026, with mandatory adherence beginning on March 1, 2027 after the transition period.
For a finished product carrying a GOTS claim, certified material has to remain identifiable as it moves through the relevant supply chain. A Scope Certificate shows which products and activities are covered for a certified organization. Transaction documentation connects certified goods and quantities to actual commercial movements.
That chain can include spinning, knitting, wet processing, garment manufacturing and trading, depending on the product route.
Organic Cotton Supply Is Still Small Compared With Total Cotton Production
Global cotton production was approximately 24.5 million tonnes in 2023/24. Textile Exchange estimated around 706,000 tonnes certified under one or more recognized organic farm standards or programs during the same period, equal to about 2.9% of global cotton production.
The figure is approximate because certification schemes can overlap and reporting coverage differs between countries.
For a mill, the available pool becomes smaller again when an order adds requirements such as country of origin, staple length, micronaire, strength, organic certification, yarn count and delivery timing.
Certification itself also costs money. USDA describes certification expenses ranging from a few hundred dollars to several thousand dollars, depending on the certifier and the size and complexity of the operation.
Farm production costs do not move in one direction everywhere. In the Madhya Pradesh trial, variable production costs for conventional cotton averaged 38% above the organic systems, largely because fertilizer and crop-protection expenses were higher. Manual weeding was common throughout that trial. California data cited in the same research literature recorded organic production costs around 25% above conventional cotton and 60% above an integrated pest-management system, with manual weed control contributing heavily to the cost difference.
MOQ Depends on How Far Upstream the Fabric Has to Be Developed
A factory that already holds certified organic 220 GSM black jersey can cut a new T-shirt style from existing fabric without commissioning a new yarn and fabric run.

A custom fabric takes a different route. If the buyer specifies cotton origin, HVI ranges, combed compact 24/1 yarn, 245 GSM jersey, a particular loop length, custom black shade and dimensional-stability targets, the supplier may need to reserve fiber, spin a dedicated yarn lot, knit a greige batch and meet the dyehouse minimum.
Each production stage has a practical batch size. The spinning mill needs enough fiber to run the yarn efficiently. The knitting mill needs enough yarn to justify machine setup. The dye house needs enough fabric for the chosen machine and liquor volume. Those batch requirements are what push the garment MOQ upward.
What the Purchase Order Still Needs After the Cotton Is Chosen
Writing 100% certified organic cotton on a purchase order establishes the fiber-origin requirement. A production-ready T-shirt specification normally goes further:
- required certification and chain-of-custody documents;
- cotton origin or HVI range where controlled;
- yarn count;
- carded or combed preparation;
- spinning route;
- knit construction;
- target GSM and tolerance;
- finished usable width;
- approved color standard;
- laundering method for dimensional testing;
- maximum dimensional change;
- spirality limit;
- pilling method, cycle count and minimum grade;
- bursting-strength method and minimum result;
- wash and rubbing colorfastness;
- perspiration colorfastness where the product requires it.
A heavyweight jersey line might read:
100% certified organic cotton / combed compact 26/1 / single jersey / 220 GSM ± agreed tolerance / 175 cm usable width ± agreed tolerance / approved black lab dip / specified dimensional-change limits after laundering / maximum spirality / required pilling grade / minimum bursting strength / wash and rubbing colorfastness / required certification documentation.