FashionMe · Fabric Performance
Moisture Wicking and Fiber Cross Sections
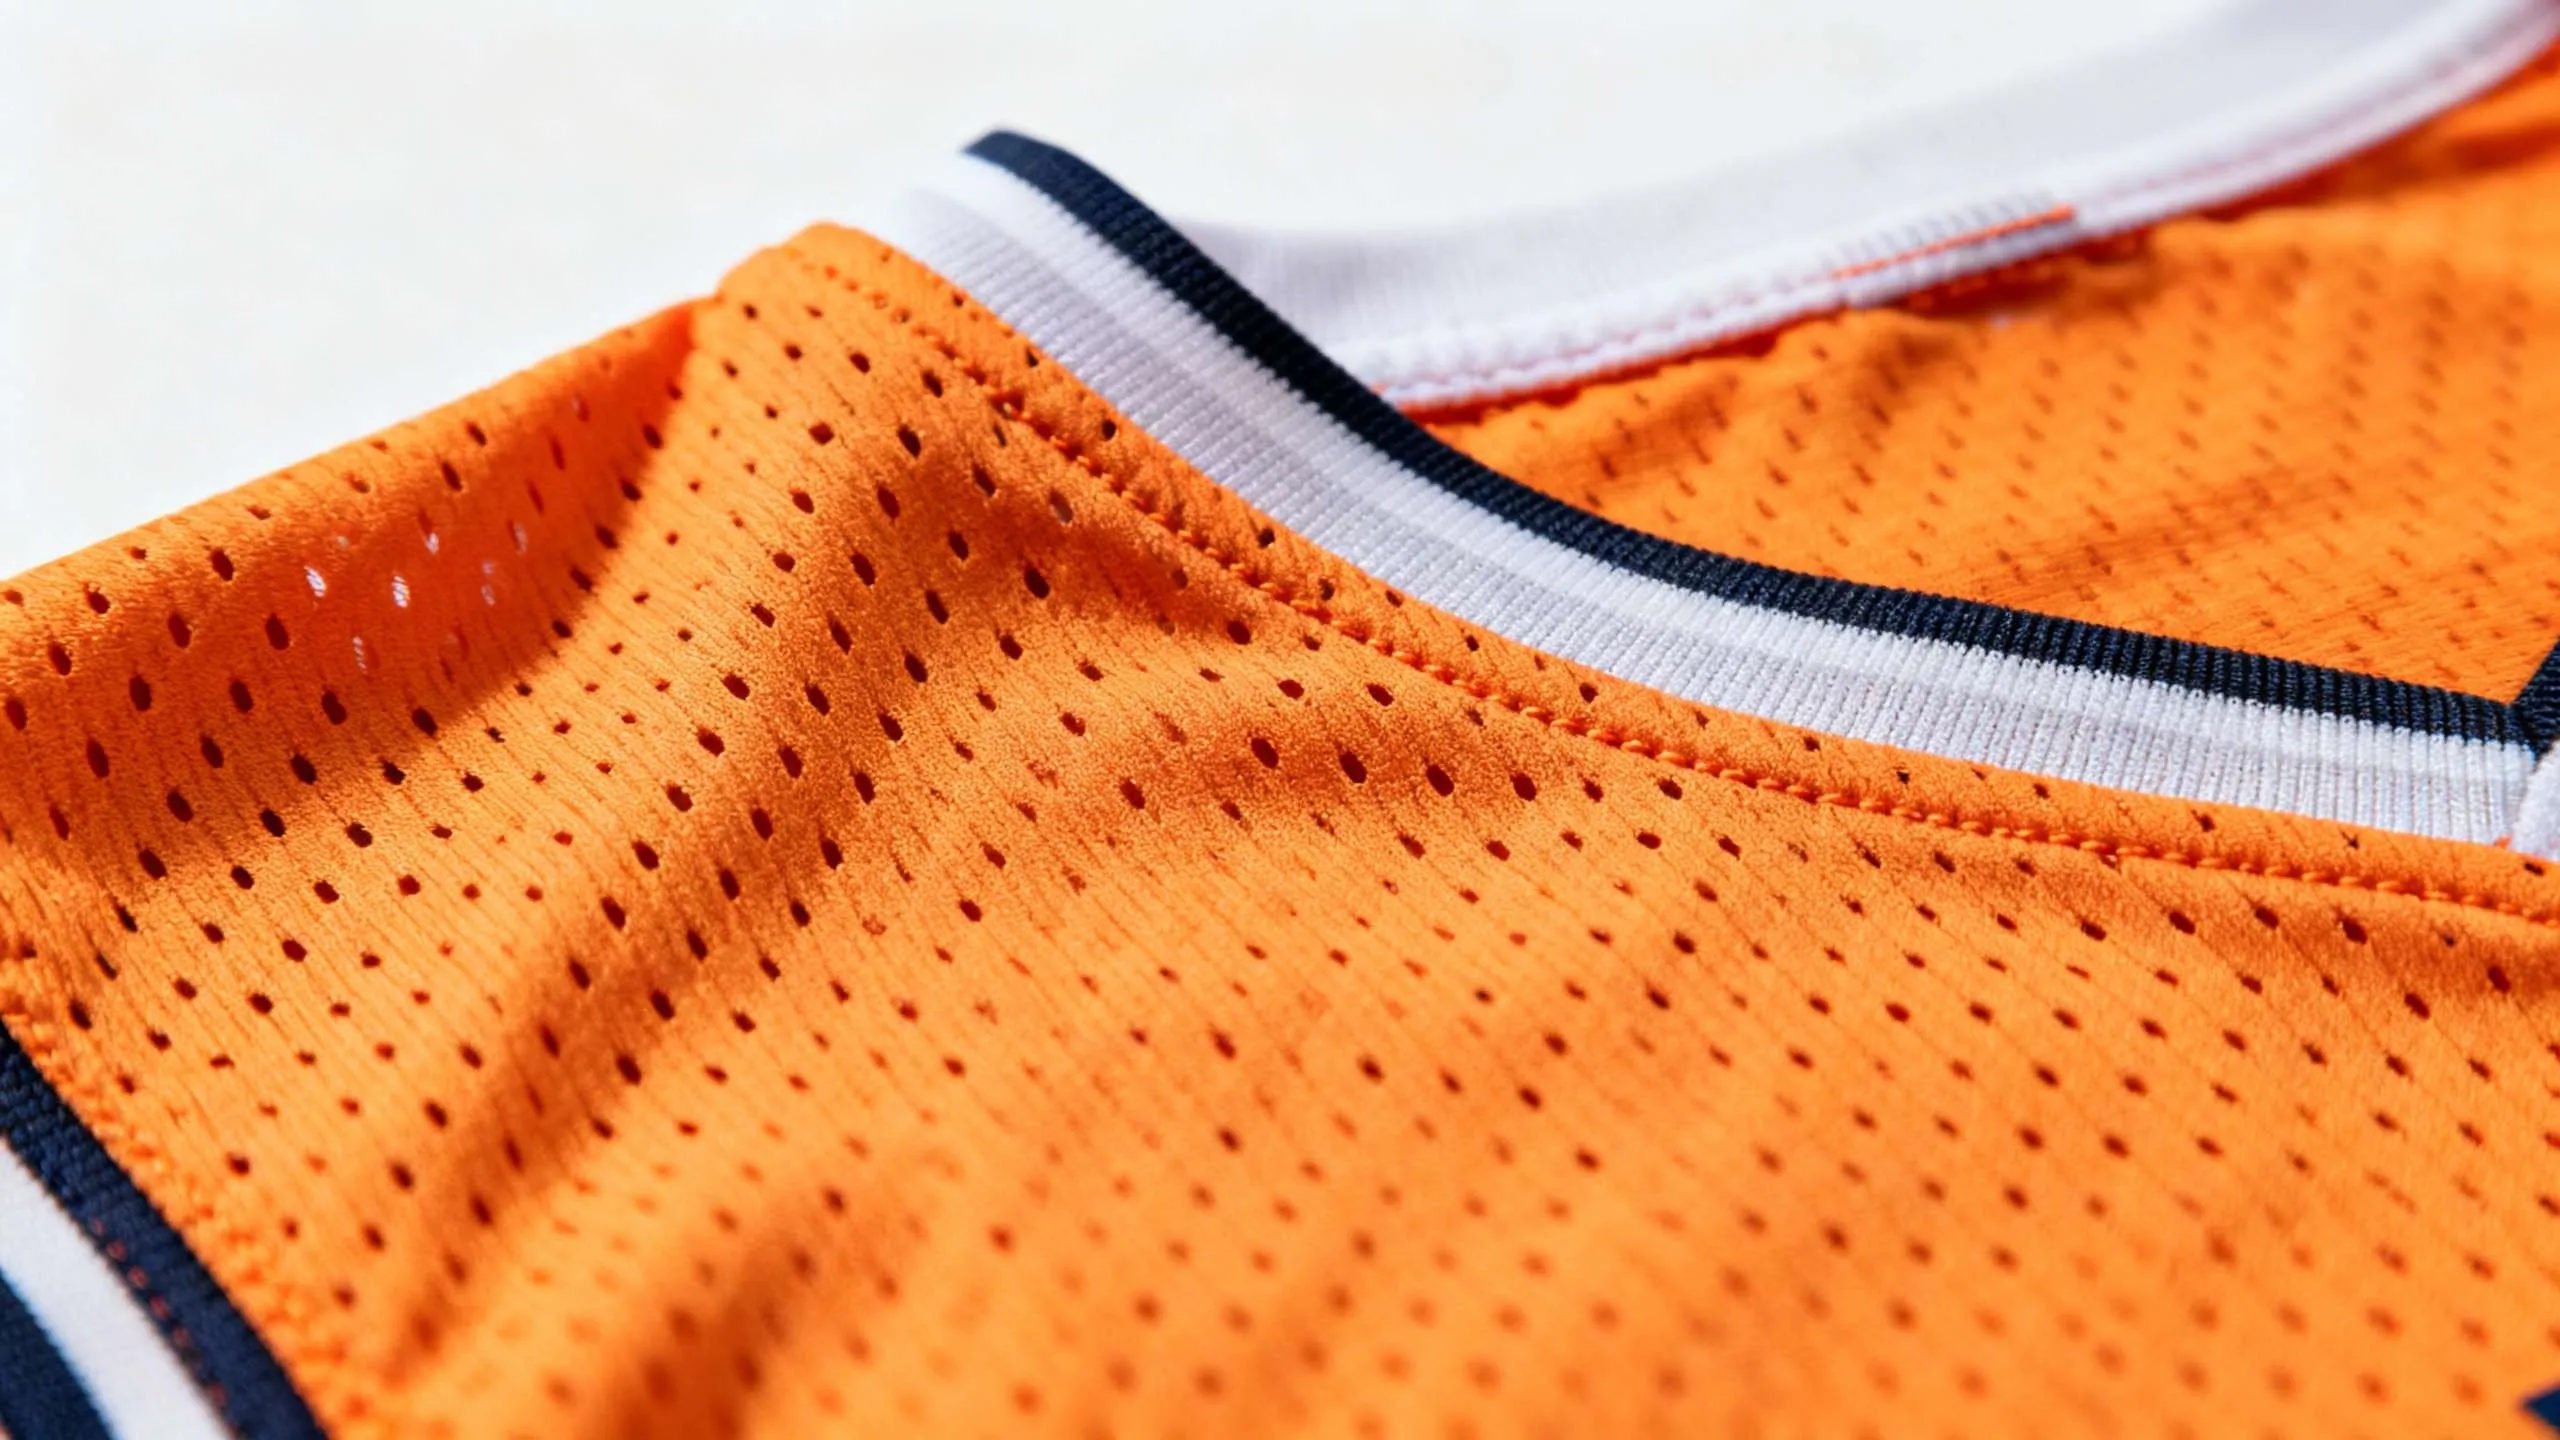
Sweat reaching a polyester sports jersey first meets the spaces around the fibers. Some are only a few micrometers wide. Larger openings appear where yarns touch and where knitted loops leave space in the fabric.
Polyester itself holds very little moisture. PET fiber data commonly puts equilibrium moisture regain near 0.4%, with a specific gravity around 1.38. That low regain says little about how far liquid sweat can travel through a finished jersey. Most of the liquid moves along filament surfaces and through connected pores.
Fiber cross section starts shaping those routes before the yarn reaches a knitting machine.
Inside a 150D Polyester Yarn
A 150D yarn weighs 150 grams per 9,000 meters. That tells you the mass of the complete yarn. Filament count is a separate number.
One set of sportswear fabrics used the same 150D polyester yarn size with five different filament counts.
| Yarn | Filament count | Denier per filament |
|---|---|---|
| 150D/34f | 34 | 4.40 dpf |
| 150D/48f | 48 | 3.13 dpf |
| 150D/108f | 108 | 1.39 dpf |
| 150D/144f | 144 | 1.04 dpf |
| 150D/288f | 288 | 0.52 dpf |
All five were knitted as single jersey on a 28-gauge circular machine using a 2.9 mm stitch length.
If those filaments are treated as ideal solid circles and PET density is taken as 1.38 g/cm³, their approximate diameters come out at:
- 4.40 dpf: about 21.2 µm
- 3.13 dpf: about 17.9 µm
- 1.39 dpf: about 11.9 µm
- 1.04 dpf: about 10.3 µm
- 0.52 dpf: about 7.3 µm
These are calculated equivalent diameters. Lobed and hollow fibers need microscope measurements because a circular calculation cannot represent the extra perimeter or internal voids.
A 150D/34f yarn contains a small number of relatively coarse filaments. In a 150D/288f yarn, the same total mass is divided across hundreds of much finer filaments. That immediately changes the spaces inside the bundle.
Why 108 Filaments Climbed Highest
The five fabrics received the same moisture-management finish before testing.
Preparation used a 2% wetting agent for 30 minutes at 60–70°C. The fabric was dried at 140°C. A finish containing amino silicone polyether copolymer and hydrophilic polymer was then applied at a 1:2 ratio, pH 5.5, at 60–70°C, followed by drying and curing at 160–170°C.
After 30 minutes of vertical wicking, the results were:
| Yarn | Wale direction | Course direction |
|---|---|---|
| 34f | 13.95 cm | 12.40 cm |
| 48f | 15.05 cm | 12.65 cm |
| 108f | 16.20 cm | 14.70 cm |
| 144f | 15.75 cm | 14.50 cm |
| 288f | 14.05 cm | 12.45 cm |
The longest rise came from the 108-filament yarn, whose ideal circular filament diameter works out to roughly 11.9 µm.
The 288f yarn used much finer filaments near 7.3 µm equivalent diameter and reached 14.05 cm in the wale direction.
Finer filaments had improved vertical movement up to a point. Pushing the count from 108f to 288f changed the pore network enough for the measured rise to fall.
One Milliliter Spread Across 128.34 cm²
The same fabrics behaved differently when water was allowed to spread across the surface.
Each specimen received 1 mL of water.
| Yarn | Final wet area | Time to reach it |
|---|---|---|
| 34f | 88.12 cm² | 61.2 s |
| 48f | 94.53 cm² | 66.6 s |
| 108f | 101.23 cm² | 72.0 s |
| 144f | 115.75 cm² | 86.4 s |
| 288f | 128.34 cm² | 124.8 s |
The 288f fabric eventually covered 128.34 cm². That is 40.22 cm² more than the 34f specimen.
It also took much longer to get there: 124.8 seconds, compared with 61.2 seconds for 34f.
So the fabric that produced the greatest final surface area was not the one that had carried liquid highest in the vertical strip test. The two measurements follow different routes through the same structure.
What Changes When a Filament Is No Longer Round
Round polyester already leaves capillary spaces inside a yarn.
Put three circular filaments together and their curved walls leave an empty region in the middle. A multifilament yarn contains large numbers of these irregular gaps, connected in different ways along its length.
Change the filament shape and the perimeter changes with it.
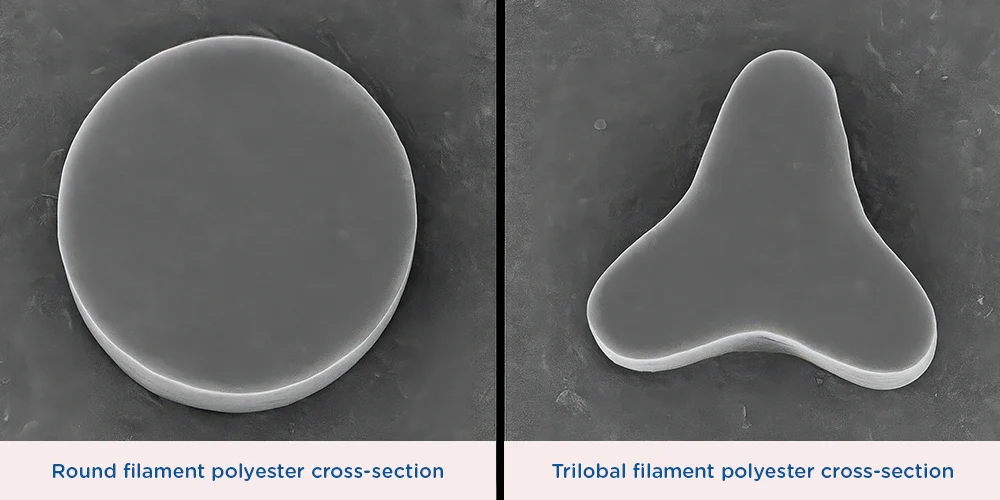
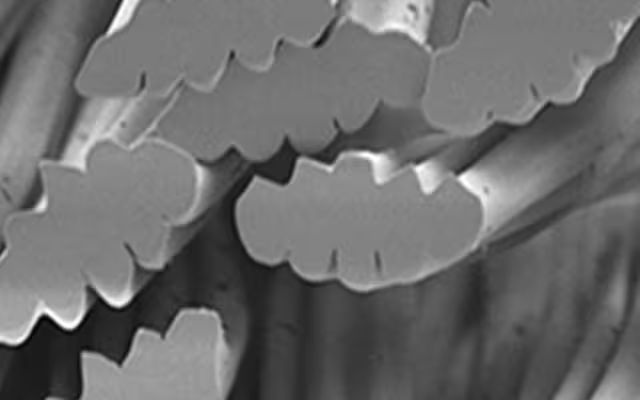
A five-leaf profile has recesses running between the lobes. Those recesses continue down the filament. When several profiled filaments sit together, they touch through a less regular set of edges and valleys.
This is why “more surface area” is too vague as an explanation for moisture-wicking fiber.
The useful feature is the shape and continuity of the spaces that remain once the fibers have been assembled into yarn.
The Same 334 dtex/144f Yarn at 18 Twist Settings
A controlled polyester test used three yarns, all specified as 334 dtex/144f.
One used five-leaf filaments with false-twist texturing. Another used circular filaments with the same type of texturing. The third contained circular parallel-drawn filaments.
Residual spinning oil was removed before the capillary test.
The yarns were prepared at:
0, 42, 83, 125, 167, 208, 250, 292, 333, 375, 475, 575, 675, 775, 875, 975, 1,075 and 1,175 TPM.
Preparation used 9.8 cN pre-tension and a 700 mm clamp distance.
For each measurement, about 10 mm of yarn was dipped into a 0.5% potassium chromate solution. Samples stayed inside a saturated-vapor chamber for 30 minutes, and every setting was measured five times.
Across most of the practical twist range, the five-leaf textured yarn sat highest on the published capillary-rise curves. The textured circular yarn followed lower down. The parallel-drawn circular yarn recorded smaller rises through much of the series.
The paper published those individual centimeter values as graphs, so exact peak heights need formal figure digitization before they can be quoted as precise decimals.
What Twist Does to the Space Between Filaments
The first additions of twist brought the filaments into more consistent contact. Wicking increased.
As compression continued, the curves reached their maxima and began to fall. By the upper end of the test, close to 1,175 TPM, the differences among the three yarns had become much smaller.
The cross section itself remained unchanged throughout the series. What changed was the amount of open, connected space around it.
False-twist texturing had already introduced another change before the deliberate twist was added. Crimp made the filament paths less straight and created local variation in contact and spacing. That is why two circular-filament yarns in the same study could produce different wicking results.
Water Has to Wet the Surface First
Capillary geometry only becomes useful once liquid enters it.
Contact-angle measurements show how much polyester surface behavior can change after treatment.
One alkaline-hydrolysis study measured untreated knitted polyester at 135.8 ± 1.2°.
| Treatment time | Contact angle |
|---|---|
| 15 min | 34.9 ± 43.5° |
| 30 min | 25.0 ± 31.2° |
| 45 min | 12.6 ± 16.3° |
| 60 min | 0.0 ± 0.0° |
The large standard deviations in the partially treated samples are useful. A textile surface is not perfectly uniform, so droplets placed at different points can encounter different local conditions.
In another study, untreated polyester measured 87.5°. Oxygen-plasma treatment made the test droplet disappear into the fabric immediately.
A silica-chitosan system reported 122° before treatment and 0° after treatment.
Those values belong to different fabrics and different treatment systems. They should stay attached to their original test conditions.
A 124 GSM Profiled Polyester Knit Reached 18 cm
A 2025 study gives enough construction detail to see what a profiled filament looked like after it had become fabric.
The S1 sample used 150D/144F profiled polyester filament.
Its finished measurements were:
- 124 GSM
- 0.61 mm thickness
- 64% porosity
- 64 courses per 5 cm
- 96 wales per 5 cm
- 0.27% moisture absorption
SEM images showed longitudinal grooves along the filament surfaces.
The wicking strips measured 3 × 25 cm.
After 30 minutes, liquid had climbed 18 cm in the longitudinal direction.
Now the number has context. It came from a 124 GSM knit with 64% porosity, a measured thickness of 0.61 mm and a known loop density.
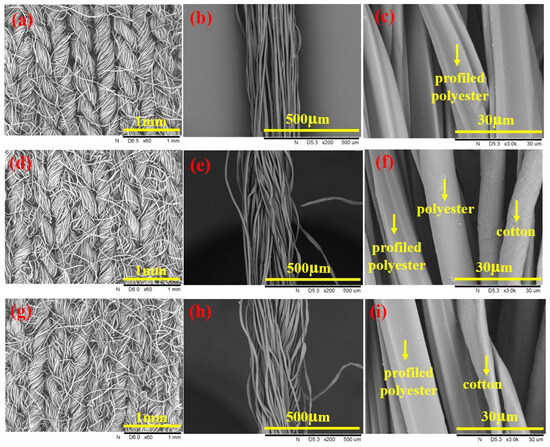
Adding Cotton Changed More Than Absorbency
Two related fabrics used combination yarns made from 75D/72F profiled polyester and 9.84 tex spun yarn. The finished combination yarn measured 18.45 tex with 470 TPM S twist.
The three constructions were:
| Sample | Construction | Porosity | Thickness | GSM | Moisture absorption |
|---|---|---|---|---|---|
| S1 | 150D/144F profiled PES | 64% | 0.61 mm | 124 | 0.27% |
| S2 | Profiled PES + PES/cotton 80/20 | 59% | 0.70 mm | 132 | 0.85% |
| S3 | Profiled PES + cotton | 59% | 0.69 mm | 130 | 2.69% |
S1 produced the longest vertical reservoir rise.
Moisture absorption increased to 0.85% in S2 and 2.69% in S3 as cotton entered the yarn system.
That extra absorbent material also changed how much liquid remained available to continue traveling through the profiled-polyester channels.
Ten Microliters Gives a Different Kind of Test
The same fabrics were later given small, controlled drops:
10 µL, 50 µL, 100 µL and 150 µL.
At 10 µL, the cotton-rich S3 structure distributed the limited liquid effectively through its yarn system. Larger doses changed how much water entered the absorbent part of the yarn and how much continued spreading.
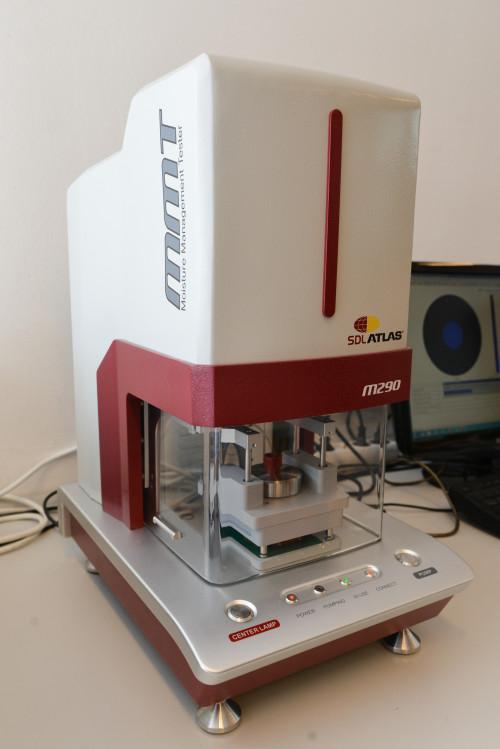
The study then moved to a Moisture Management Tester.
Each sample measured 8 × 8 cm and was conditioned at:
20 ± 2°C
65 ± 4% RH
The tester supplied 200 µL of water over 20 seconds. Five samples were measured for each fabric.
S3 recorded the highest OMMC in this part of the work.
The earlier 18 cm result belonged to S1 under continuous reservoir feeding. Here the amount of liquid was fixed from the start.
Reading an MMT Report Without Turning It Into One Score
A Moisture Management Tester uses sensor rings on both sides of a specimen.
The report tracks when each face becomes wet, how quickly the wet area grows and how much liquid reaches the opposite side.
Top wetting time — seconds before the application face registers liquid.
Bottom wetting time — time required for liquid to reach the other face.
Absorption rate — rate of liquid accumulation detected at a surface.
Maximum wetted radius — farthest radial distance reached by the wet front.
Spreading speed — movement of that front in millimeters per second.
Accumulative one-way transport — calculated liquid distribution between the two surfaces.
OMMC — a combined moisture-management index.
A commonly published OMMC relationship is:
OMMC = 0.25 × BAR + 0.50 × R + 0.25 × SSB
BAR is the normalized bottom absorption-rate term. R represents normalized one-way transport. SSB is the normalized bottom spreading-speed term.
Published TM195 grading systems commonly put:
- maximum wetted radius above 22 mm in the largest band
- spreading speed above 4 mm/s in the fastest band
- one-way transport above 400 in the highest band
- OMMC above 0.8 in the highest band
A brand can attach its own pass limits to the individual measurements.
Polyester on the Skin Side of a Plated Knit
A plated-knit study produced a fabric identified as PES/Co. Polyester occupied the application side and cotton formed the opposite face.
The fabric measured 1.20 mm thick.
| Measurement | PES/Co |
|---|---|
| Top wetting time | 8.1 s |
| Bottom wetting time | 4.0 s |
| Top absorption rate | 22.0%/s |
| Bottom absorption rate | 68.0%/s |
| Top wetted radius | 15 mm |
| Bottom wetted radius | 30 mm |
| Top spreading speed | 1.8 mm/s |
| Bottom spreading speed | 4.2 mm/s |
| One-way transport | 392.5 |
| OMMC | 0.90 |
Liquid reached the opposite face in 4.0 seconds and spread to a 30 mm radius there. Spreading speed on that face reached 4.2 mm/s.
The same study also tested the yarn placement in the other direction.
| Measurement | Co/PES |
|---|---|
| Thickness | 1.23 mm |
| Top wetting time | 7.4 s |
| Bottom wetting time | 50.3 s |
| Top absorption rate | 81.1%/s |
| Bottom absorption rate | 42.2%/s |
| Top wetted radius | 20 mm |
| Bottom wetted radius | 15 mm |
| Top spreading speed | 2.7 mm/s |
| Bottom spreading speed | 0.9 mm/s |
| One-way transport | −231.8 |
| OMMC | 0.04 |
The fiber families had stayed the same. Their position through the thickness had changed, and the instrument recorded a very different liquid path.
The Same 150D/108f Yarn in Three Knits
Another fabric series kept the yarn at 150D/108f polyester and changed the knitted construction.
Five-minute vertical wicking after moisture-management finishing was:
| Structure | 2.6 mm stitch | 2.9 mm stitch | 3.2 mm stitch |
|---|---|---|---|
| Single jersey | 10.9 cm | 11.5 cm | 12.9 cm |
| Single airtex | 11.5 cm | 12.0 cm | 11.5 cm |
| Honeycomb | 10.2 cm | 11.5 cm | 10.0 cm |
Single jersey reached 12.9 cm at a 3.2 mm stitch length.
Single airtex peaked at 12.0 cm with the 2.9 mm setting. Honeycomb measured 11.5 cm at the same stitch length.
The airtex construction was reported at roughly 8% greater thickness than the related single-jersey reference. Honeycomb was around 20% thicker.
No new fiber was introduced here. Loop geometry and stitch length were enough to move the wicking result by centimeters.

What Commercial Profiled Fibers Actually Look Like
Toray's PENTAS™ uses a flat multi-leaf polyester cross section with small projections around the perimeter.
Those projections leave small spaces when fibers are assembled into yarn and fabric. Toray links the geometry to capillary absorption and liquid diffusion.
Its public technical information does not give one fixed percentage that can be applied to every PENTAS fabric. Finished-fabric testing is still needed for the exact yarn and knit being purchased.
Teijin Frontier's Octa™ uses a very different profile. Eight radial fins surround a hollow center.
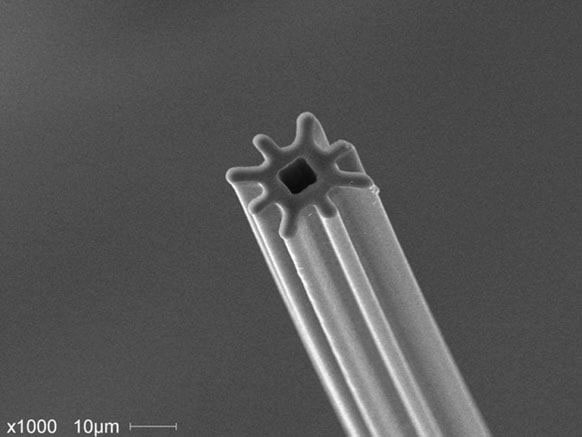
One commercial comparison reports:
| Property | Octa sample | Round-fiber sample |
|---|---|---|
| Yarn | 40D/12f | 75D/36f |
| Fabric mass | 95.2 GSM | 175.9 GSM |
| Thickness | 0.480 mm | 0.398 mm |
| Bulkiness | 5.05 cm³/g | 2.27 cm³/g |
| Apparent fabric density | 0.20 g/cm³ | 0.44 g/cm³ |
| Air permeability | 372.8 cc/cm²·s | 264.7 cc/cm²·s |
The two samples use different yarn deniers and different fabric weights, so those numbers describe two finished constructions. They cannot be used as a clean percentage gain caused by cross section alone.
What the Hollow Center Is Doing
A hollow filament can look like a microscopic tube in a cross-section image.
Along a continuous synthetic filament, the central void may remain enclosed. Sweat touching the outside surface has no direct path into a sealed cavity.
The hollow region reduces the amount of polymer inside a given outer dimension. With PET density around 1.38 g/cm³, removing material from the center lowers the solid mass carried by that filament envelope.
In Octa, liquid reaching the outside encounters the radial fins and the irregular spaces created where neighboring fibers meet.
The center void contributes to density, bulk and thermal behavior.
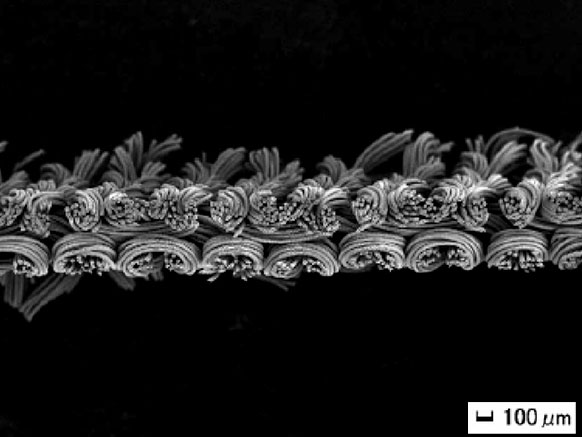
After Five Washes and Ten Washes
The single-jersey, airtex and honeycomb fabrics were tested again after laundering.
At a 2.9 mm stitch length:
| Structure | After 5 washes | After 10 washes |
|---|---|---|
| Single jersey | 15.5 cm | 17.8 cm |
| Single airtex | 17.5 cm | 18.0 cm |
| Honeycomb | 14.3 cm | 15.5 cm |
The 3.2 mm single-jersey sample reached 16.0 cm after five washes.
After ten washes, it measured 18.5 cm.